Overview
VizSSTA explored how augmented reality and tablet-based interfaces could improve the way users interact with and understand spatial analysis data. Traditional spatial analysis systems often rely on dense 2D visualizations, which can make it difficult for users to connect analytical information with real-world environments.
The project investigated how a hybrid interface combining tablets and augmented reality could create a more intuitive and immersive way to explore spatial relationships, environmental data, and physical context.
Problem
Users interacting with spatial analysis tools often face a high level of cognitive load because they must mentally translate abstract data into real-world spatial understanding.
- High cognitive effort: users need to interpret complex spatial layouts and analytical outputs.
- Limited environmental context: traditional 2D tools can separate data from the physical space it represents.
- Fragmented interaction: users may need to move between analysis tools, maps, diagrams, and real-world navigation.
- Accessibility for non-experts: dense visualizations can be difficult for users who are not trained in spatial analysis.
Objective
The goal of the project was to explore whether a hybrid AR + tablet interface could reduce interpretation complexity and improve spatial understanding.
- Improve spatial understanding.
- Reduce interpretation complexity.
- Create intuitive AR-assisted interactions.
- Support contextual visualization.
- Make spatial analysis more approachable for users.
Users & Context
The target users are people who need to interpret spatial relationships, environmental layouts, or analytical outputs in relation to physical surroundings. This may include researchers, planners, analysts, or users working with spatial decision-making tasks.
Unlike standard dashboard users, these users need to understand not just what the data says, but where it exists and how it relates to the surrounding environment.
Design Approach
Hybrid Interaction Model
The system combined tablet-based controls with AR visualization. Tablets supported structured interaction and analysis control, while AR supported environmental context and spatial understanding.
Contextual Visualization
Spatial data was designed to appear in relation to the physical environment, helping users connect analytical insights with real-world positioning and movement.
Simplified User Flow
The interaction flow focused on reducing unnecessary complexity, improving navigation clarity, and supporting natural exploration rather than forcing users through rigid steps.
Environment as Interface
The project treated physical surroundings as an active part of the interface, not just a background. This helped strengthen the connection between digital information and real-world interpretation.
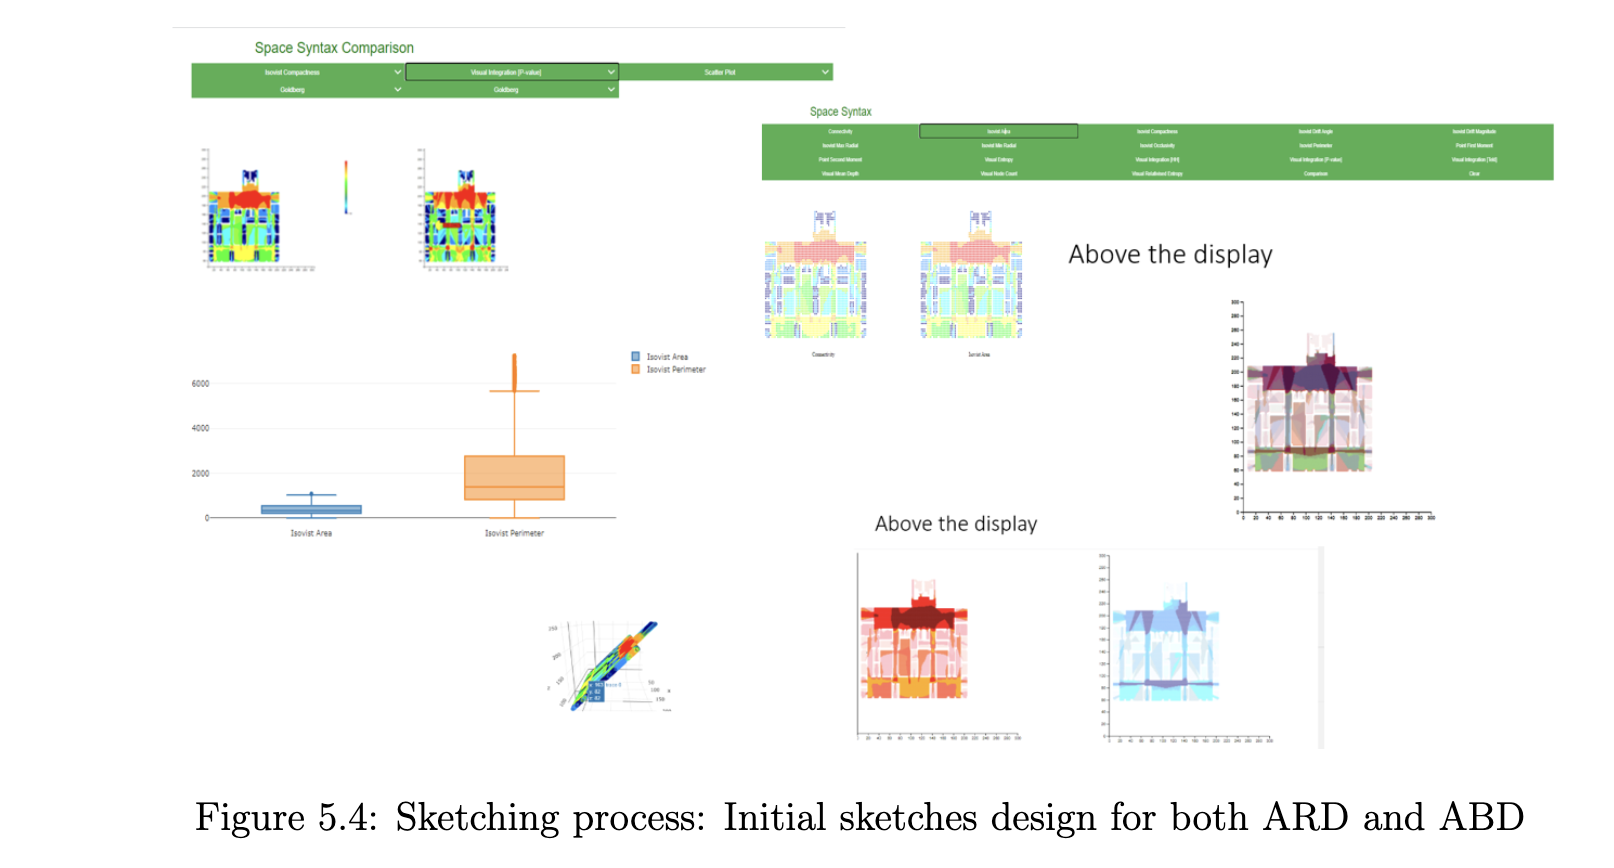
Process of Designing the Experience
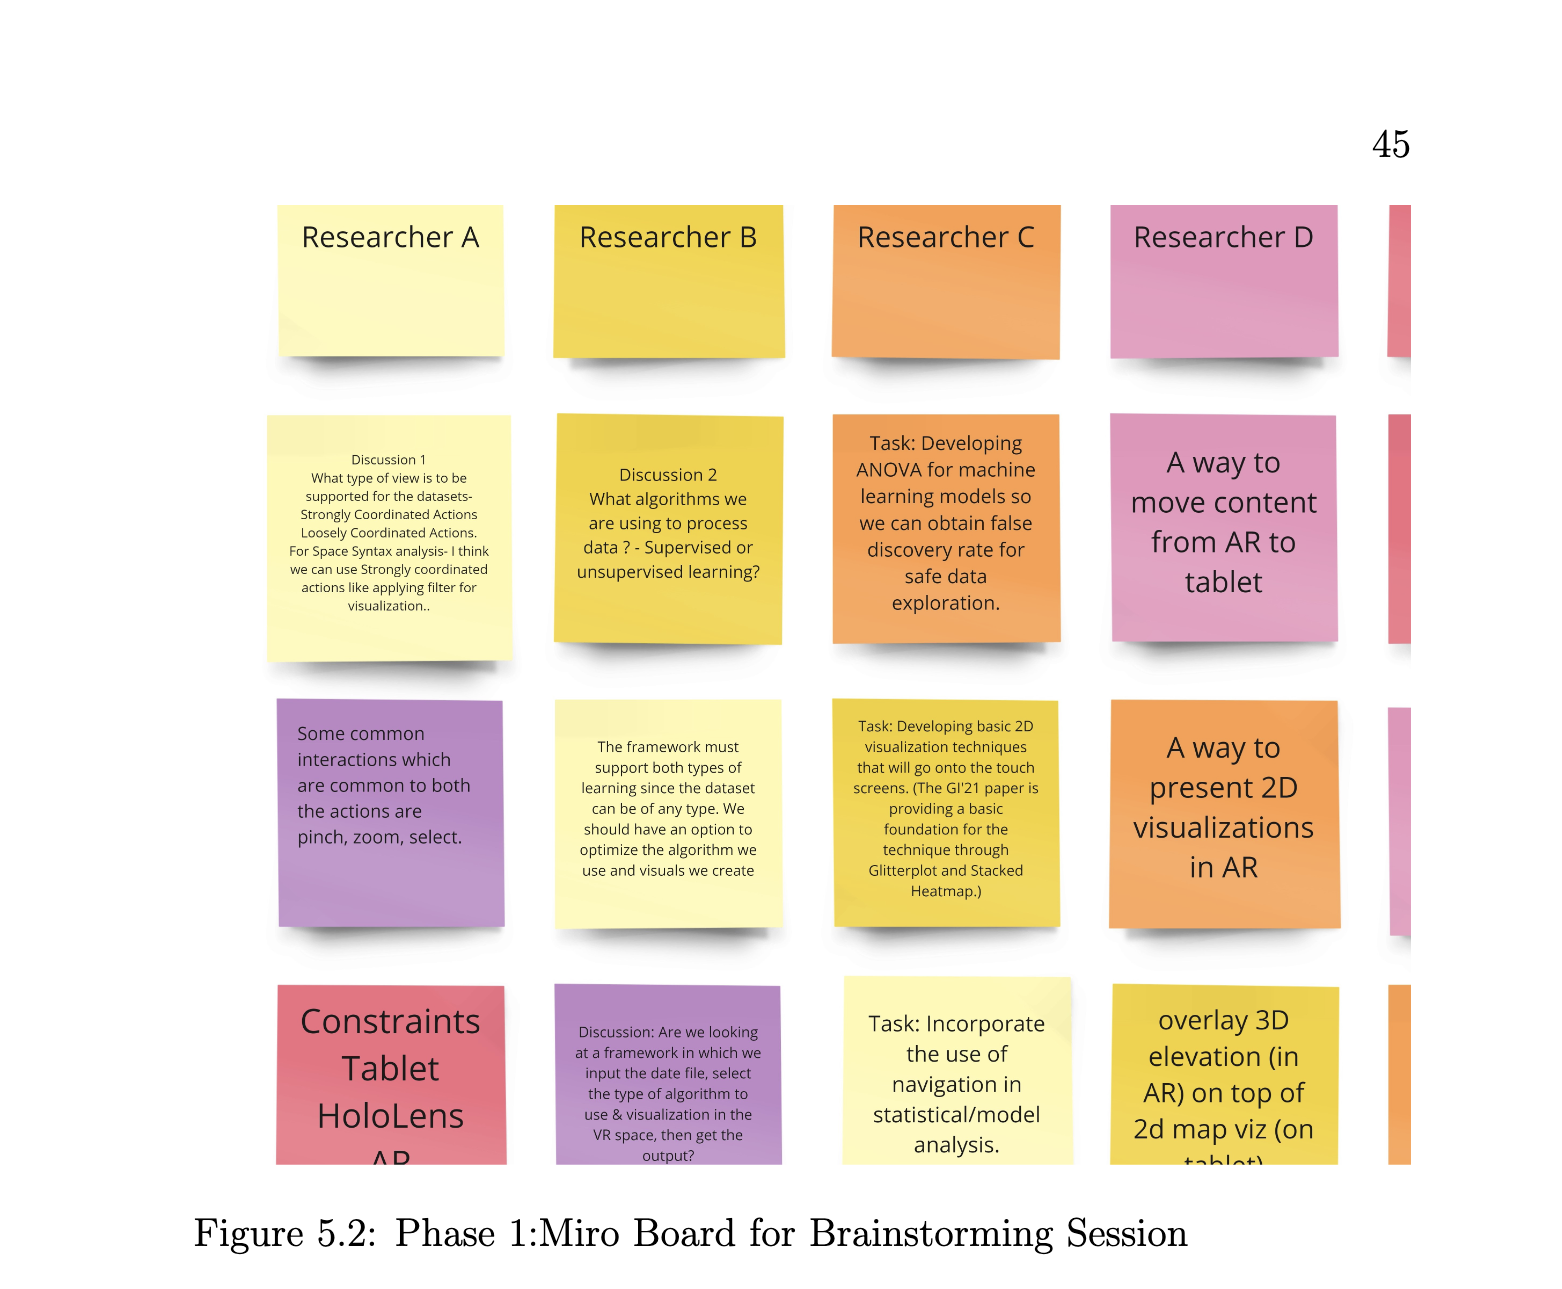
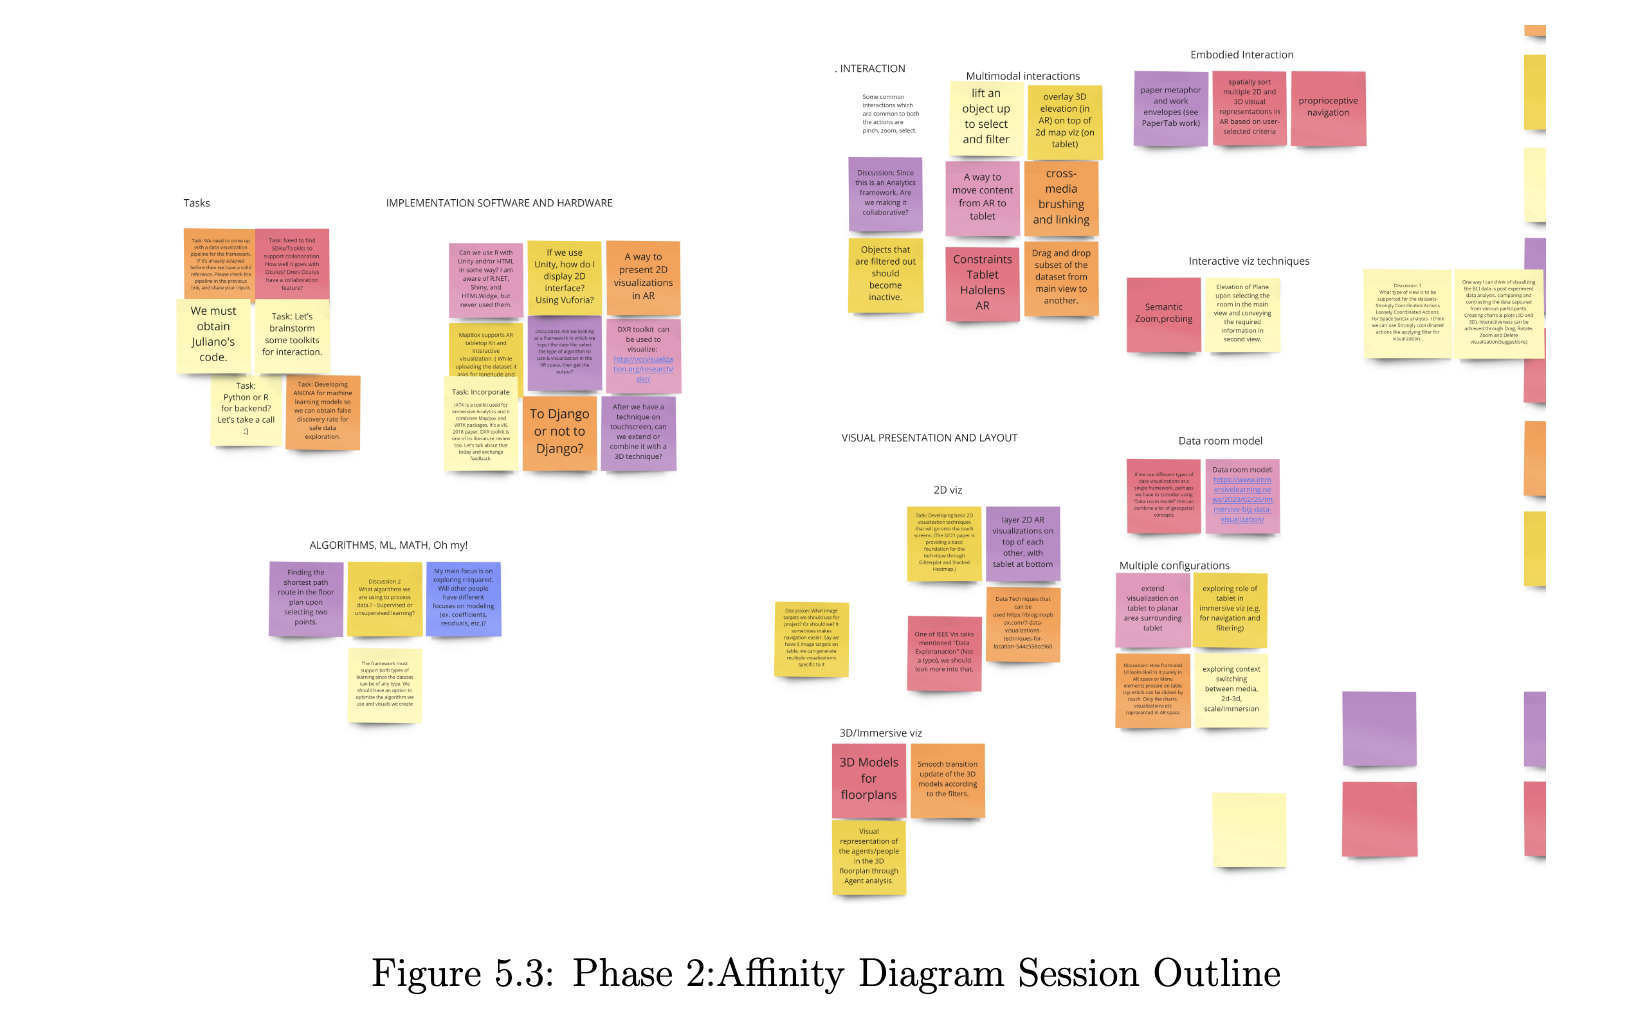
Because VizSSTA was designed as a spatial analysis tool, the design process focused on making complex Space Syntax data easier to understand through a hybrid interaction model. The challenge was not only to display data, but to help users interpret relationships between spatial attributes, floorplans, and raw visibility information in a more intuitive way.
1. Understanding the Domain Problem
The first step was understanding the complexity of Space Syntax analysis. Space Syntax data helps characterize physical environments and predict how spaces may be used. However, this type of data can be difficult to interpret when shown only through dense 2D visualizations.
From a UX perspective, the core question became: how can the interface reduce the mental effort required to connect spatial data with the physical structure of a building or floorplan?
2. Defining the User Need
The user needed a way to explore floorplans, compare spatial attributes, and understand relationships between different data layers without constantly switching context. The design goal was to support comprehension, comparison, and spatial reasoning.
3. Choosing a Hybrid Tablet + AR Model
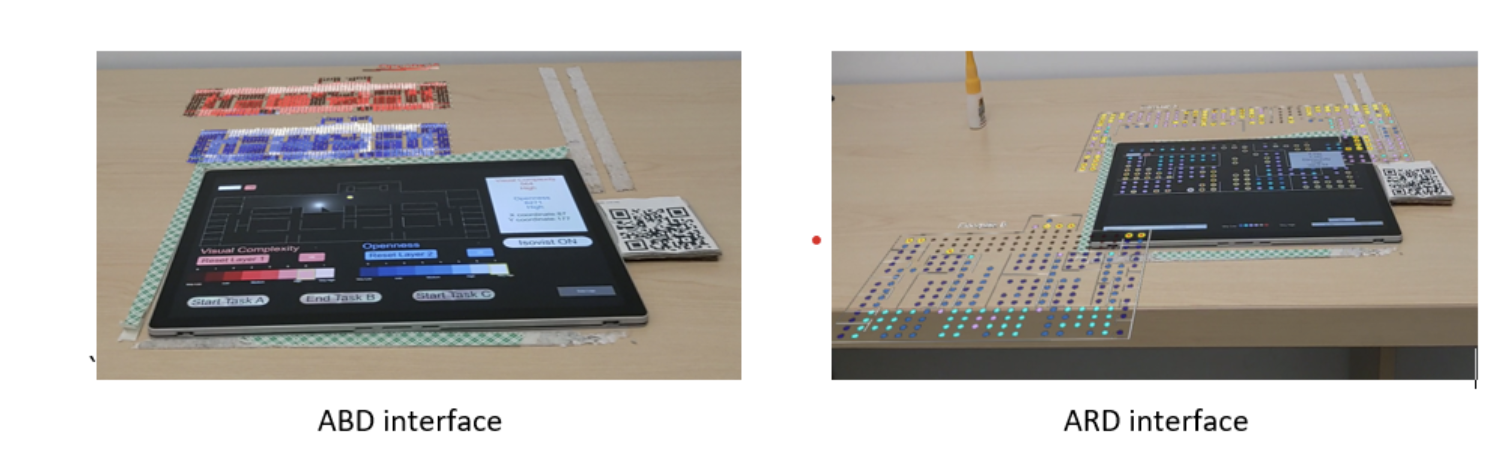
A tablet-only interface provides direct touch interaction and a familiar way to explore a floorplan. However, it can become visually crowded when multiple data layers are shown at once. To solve this, VizSSTA used the tablet as the main interaction surface and augmented reality as an additional spatial layer.
- Tablet: supported direct interaction with the floorplan.
- AR above the tablet: displayed related Space Syntax analysis layers.
- AR around the tablet: showed additional floorplans or expanded floorplan views.
4. Designing Layered Information
A key design decision was to separate information into layers rather than forcing everything into one flat screen. This allowed users to view relationships between attributes such as Openness, Visual Complexity, isovist perimeter, and connectivity without overwhelming the base floorplan.
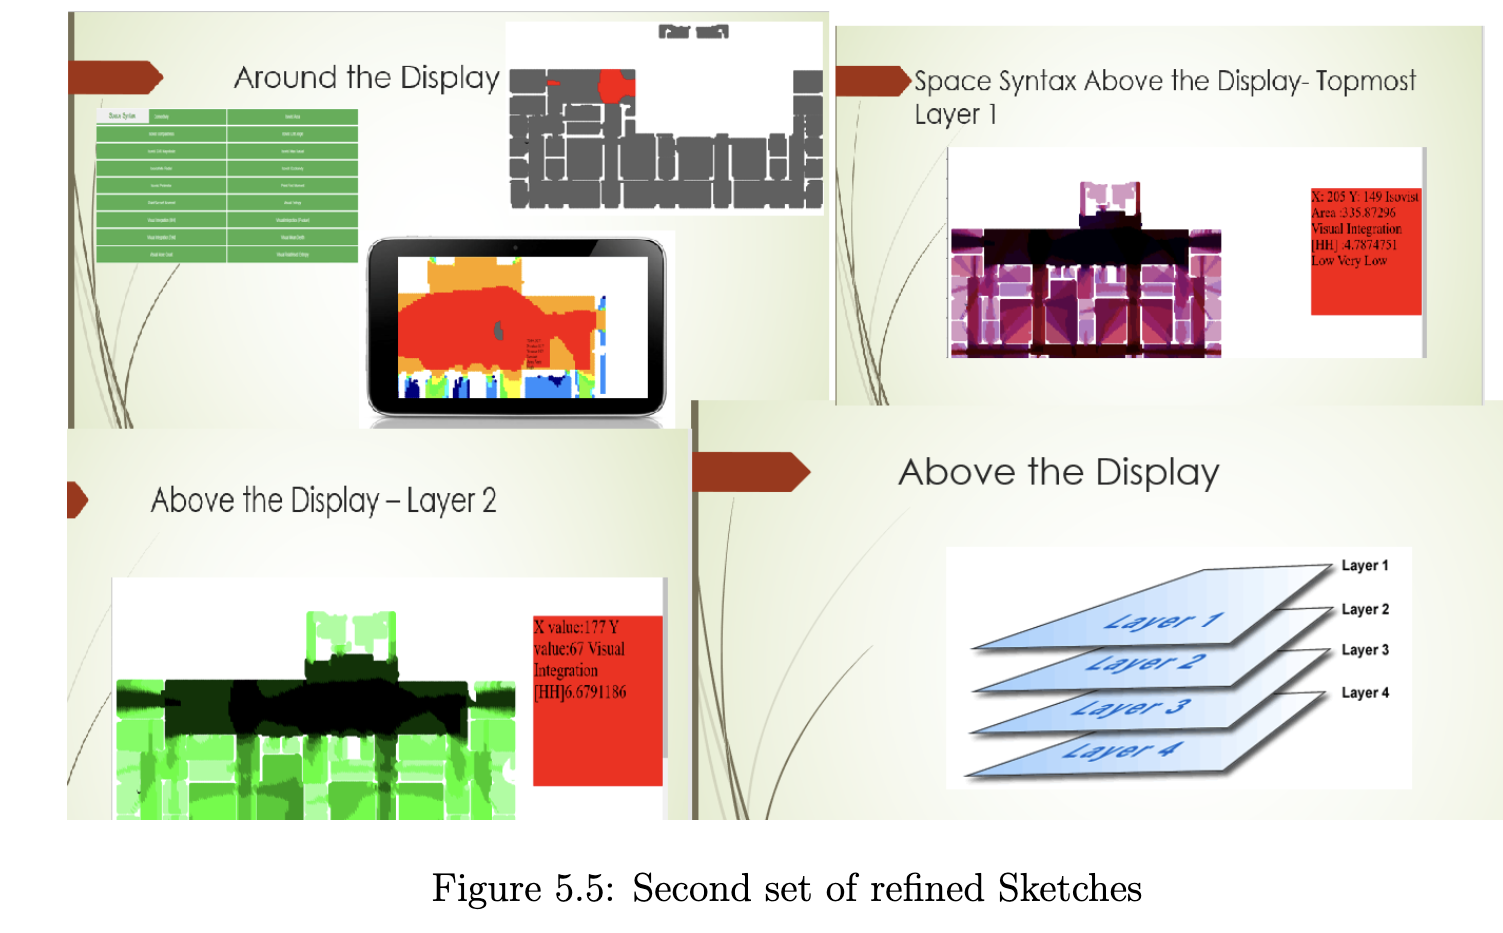
The layered model supported comparison while preserving context, which is especially important when users need to understand how multiple spatial attributes relate to one another.
5. Supporting Large Floorplan Exploration
For larger floorplans, the interface needed to help users identify regions with similar spatial attributes. The design used the area around the tablet to expand the spatial workspace, making it easier to compare regions without losing the relationship to the original floorplan.
6. Comparing Against a Tablet-Only Experience
To evaluate whether the hybrid design improved comprehension, the system was compared against a tablet-only interface. This helped identify whether AR added meaningful value beyond visual novelty.
The study tested users on tasks involving spatial attribute relationships, isovist shape and size, and identifying similar regions across large floorplans.
7. Learning from Evaluation
The evaluation showed that the hybrid AR + tablet approach helped participants better understand spatial attributes and their interrelationships. It also revealed practical design limitations, including ergonomic issues with the AR headset.
These findings informed future design improvements, including the need to balance immersive visualization with physical comfort and usability.
Design Takeaway
The most important UX takeaway from this project is that immersive technology should only be used when it improves understanding. In VizSSTA, AR was not added for visual effect; it was used to expand the workspace, separate complex data into meaningful layers, and reduce the cognitive effort of interpreting spatial relationships.
Key UX Decisions
Progressive Disclosure
Information was revealed gradually to reduce overload and help users focus on what mattered at each step.
Physical + Digital Context
The interface merged analytical information with physical surroundings to improve spatial comprehension.
Exploratory Interaction
The experience supported natural exploration rather than a rigid dashboard-only workflow.
Precision + Simplicity
The design balanced analytical power with approachable interaction patterns for non-expert users.
Outcome
The project demonstrated how immersive interfaces can improve spatial analysis experiences by making information more contextual, easier to interpret, and more naturally integrated with the user’s environment.
It also highlighted the potential of AR for complex data visualization, spatial decision-making, and human-centered interaction design.
Reflection
This project strengthened my understanding of spatial UX, immersive interaction design, contextual visualization, and human-centered design for emerging technologies.
It reinforced that strong UX is not just about interface aesthetics. It is about reducing mental effort and helping users understand information more naturally within the context where decisions happen.