Overview
Telecom field operations teams often manage service installations, provisioning requests, technician assignments, and SLA compliance across multiple disconnected systems. The objective was to create a unified SAP Fiori-inspired platform enabling operations teams to manage service orders from request creation through activation and completion.
Problem
Field operations teams faced challenges including:
- Limited visibility into order status.
- Delayed technician assignments.
- Manual approval processes.
- SLA breaches.
- Inconsistent communication between operations teams
These inefficiencies increased operational costs and negatively impacted customer satisfaction.
Research & Discovery
Key User Groups
Customer Service RepresentativesGoals:
- Create service requests
- Track installation progress
Pain points:
- Duplicate data entry
- Limited order visibility
Operations Managers:
Goals:
- Monitor team performance
- Ensure SLA compliance
Pain Points:
- Difficult workload management
- Delayed escalations
User Journey
Current Workflow
Request → Creation → Approval → Assignment → Provision → Activation → Completion
Key Pain Points:
- Manual approvals
- Limited technician visibility
- SLA tracking difficulties
Opportunities
- Real-time updates
- Automated provisioning
- Mobile approvals
- Workflow automation
Design Process
Understanding the Business Problem
The project began by understanding how telecom service orders move through the organization, from customer request submission to final service activation.
The objective was to identify operational inefficiencies, approval bottlenecks, and communication gaps that impacted service delivery and SLA compliance.
Key Questions:
- How are service orders created?
- Who approves requests?
- How are technicians assigned?
- Where do delays occur?
- How is SLA performance tracked?
Key Design Decisions
Smart Filter Bar for High-Volume Order Management
Challenge
Operations teams manage thousands of service orders daily.
Without filtering, users must scan large tables manually.
Decision
Implemented a Smart Filter Bar with:
- Order ID
- Status
- Service Type
- Date Range
- Region
- Customer
Why
Allows users to narrow results quickly and reduces time spent searching for specific orders.
Impact
Improves efficiency and supports faster operational decision-making.
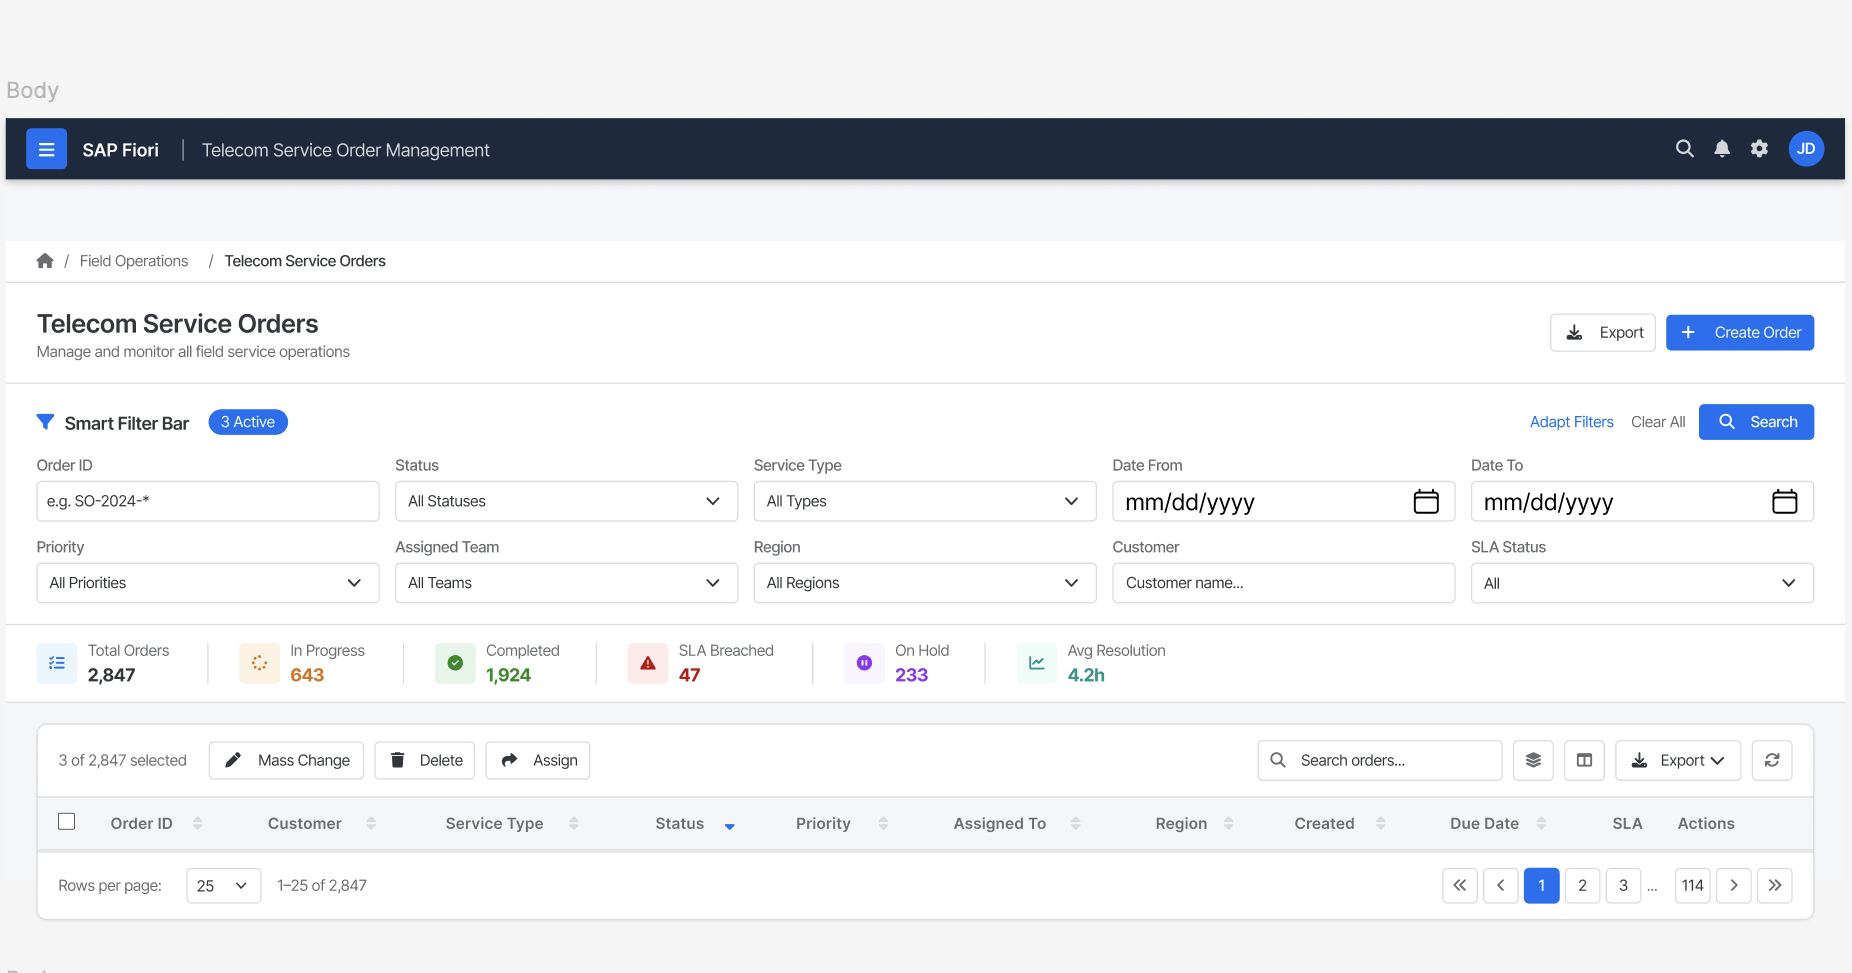
KPI Summary Cards Above the Table
Challenge
Managers need visibility into operational health before reviewing individual orders.
Decision
Added KPI cards displaying:
- Total Orders
- In Progress
- Completed
- SLA Breached
- On Hold
- Average Resolution Time
Why
Users can immediately understand workload and risk areas without analyzing raw data.
Impact
Supports proactive management of SLA risks.
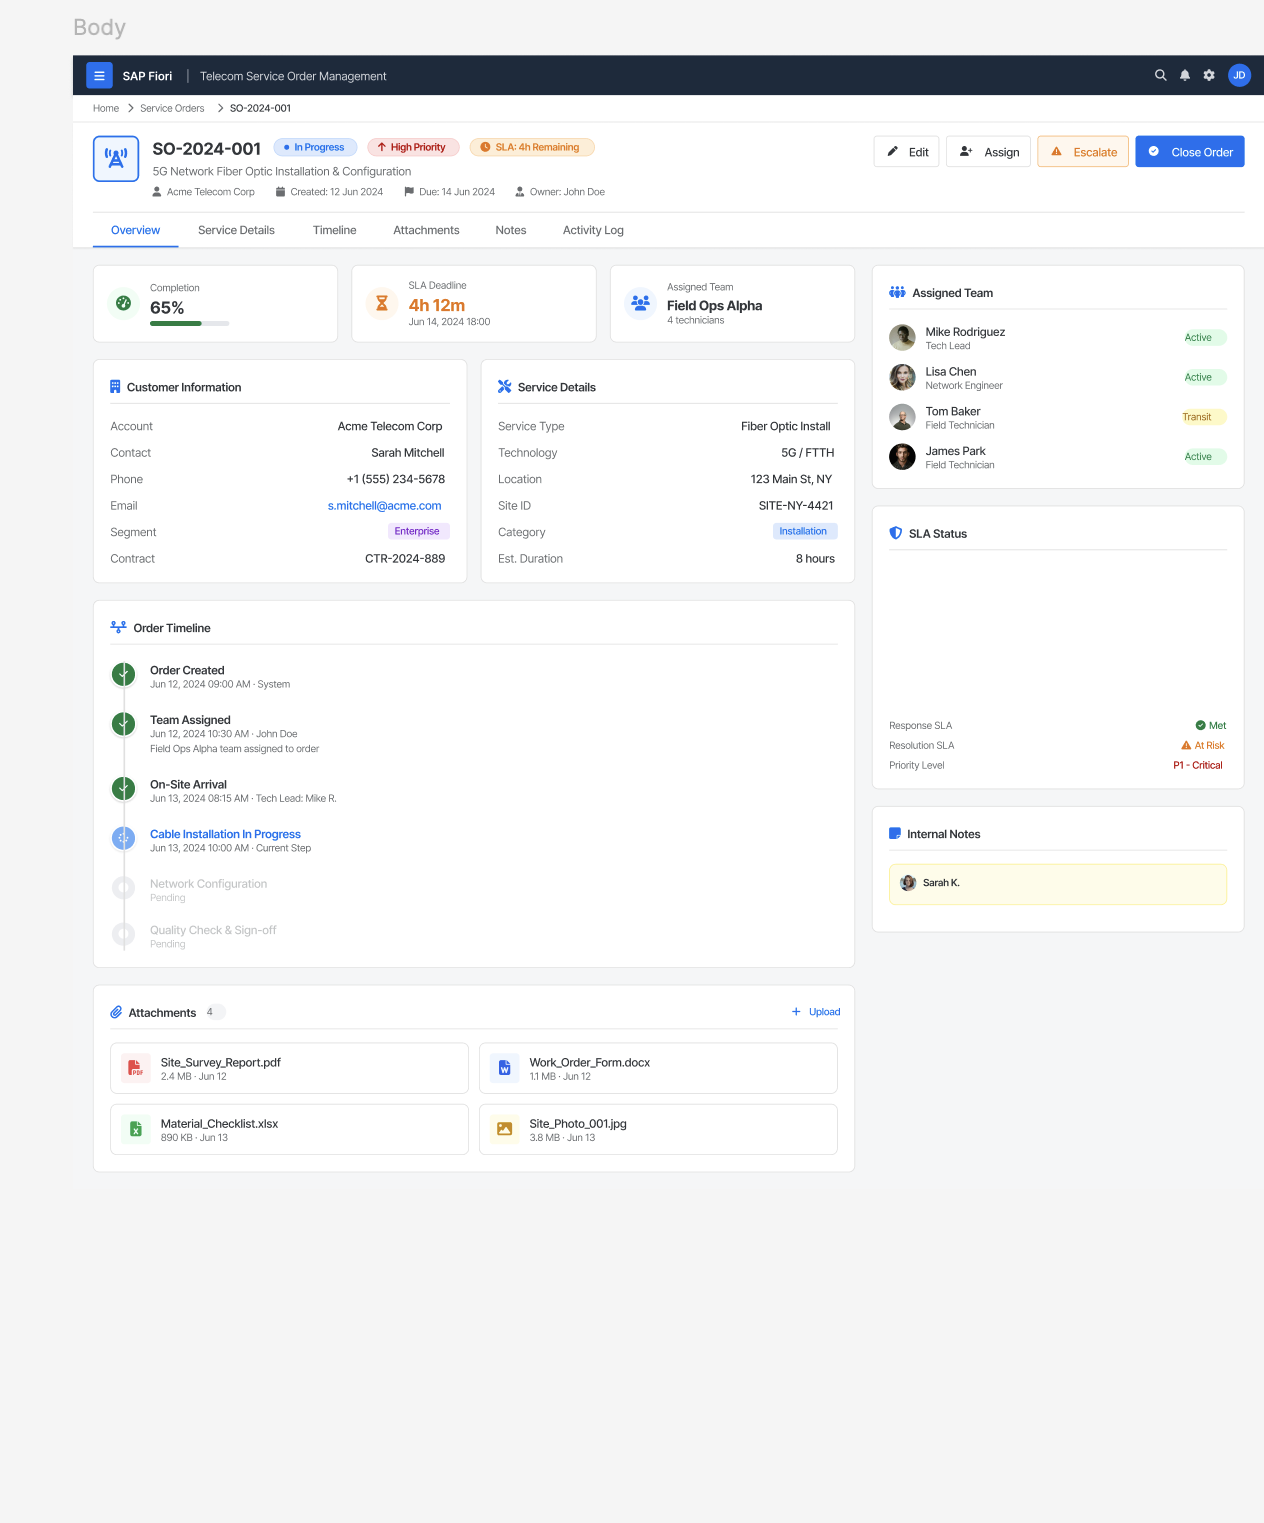
Timeline-Based Order Tracking
Challenge
Users often struggle to understand where an order currently sits within the workflow.
Decision
Introduced a visual timeline showing:
- Order Created
- Team Assigned
- Technician Arrival
- Installation
- Testing
- Completion
Why
Makes progress visible and reduces uncertainty across teams.
Impact
Improves transparency and cross-functional communication.
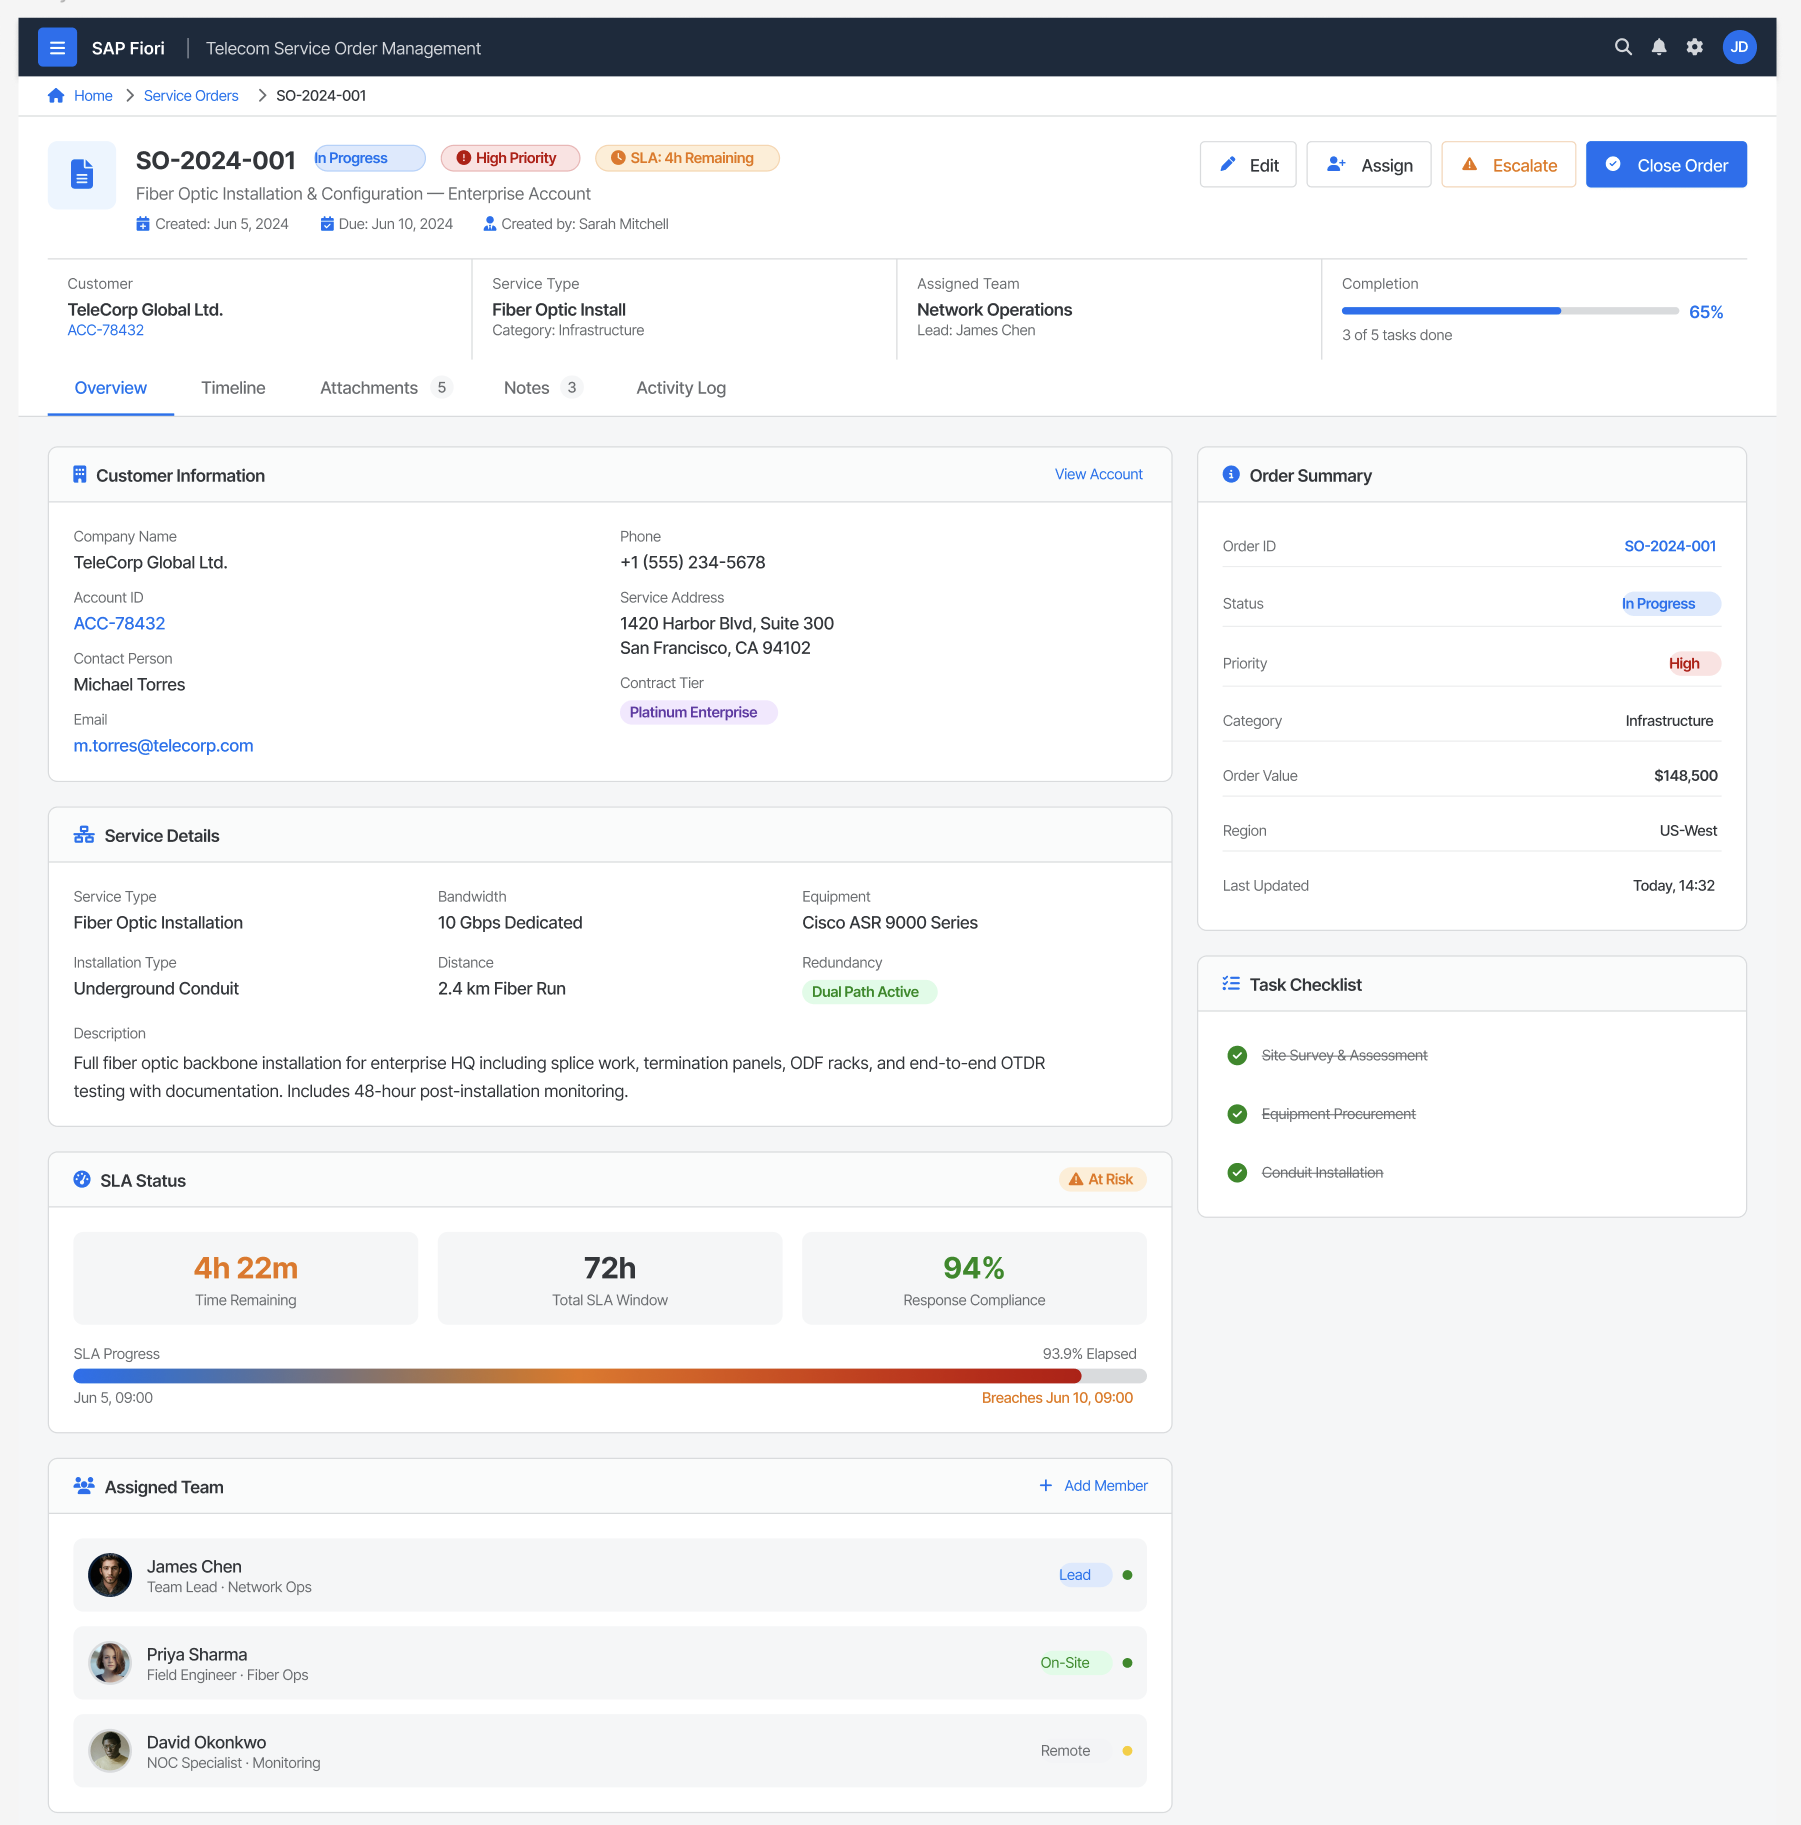
Object Page Structure for Complex Information
Challenge
Service orders contain large amounts of information.
Decision
Grouped information into sections:
- Customer Information
- Service Details
- SLA Status
- Assigned Team
- Timeline
- Attachments
- Attachments
Why
Prevents cognitive overload and improves information findability.
Impact
Allows users to focus on relevant information without excessive scrolling.
Color-Coded SLA Monitoring
Challenge
Missing an SLA deadline can impact customer satisfaction and operational performance.
Decision
Introduced semantic status indicators:
- Healthy
- At Risk
- Critical
Why
Allows users to identify urgent orders instantly.
Impact
Improves response times and prioritization.
Worklist Pattern for Approvals
Challenge
Managers often review multiple requests simultaneously.
Decision
Created a dedicated approval queue with:
- Priority
- SLA Status
- Assignee
- Approve
- Reject
- Request Changes
Why
Reduces approval friction and centralizes decision-making.
Impact
Faster turnaround for service requests.
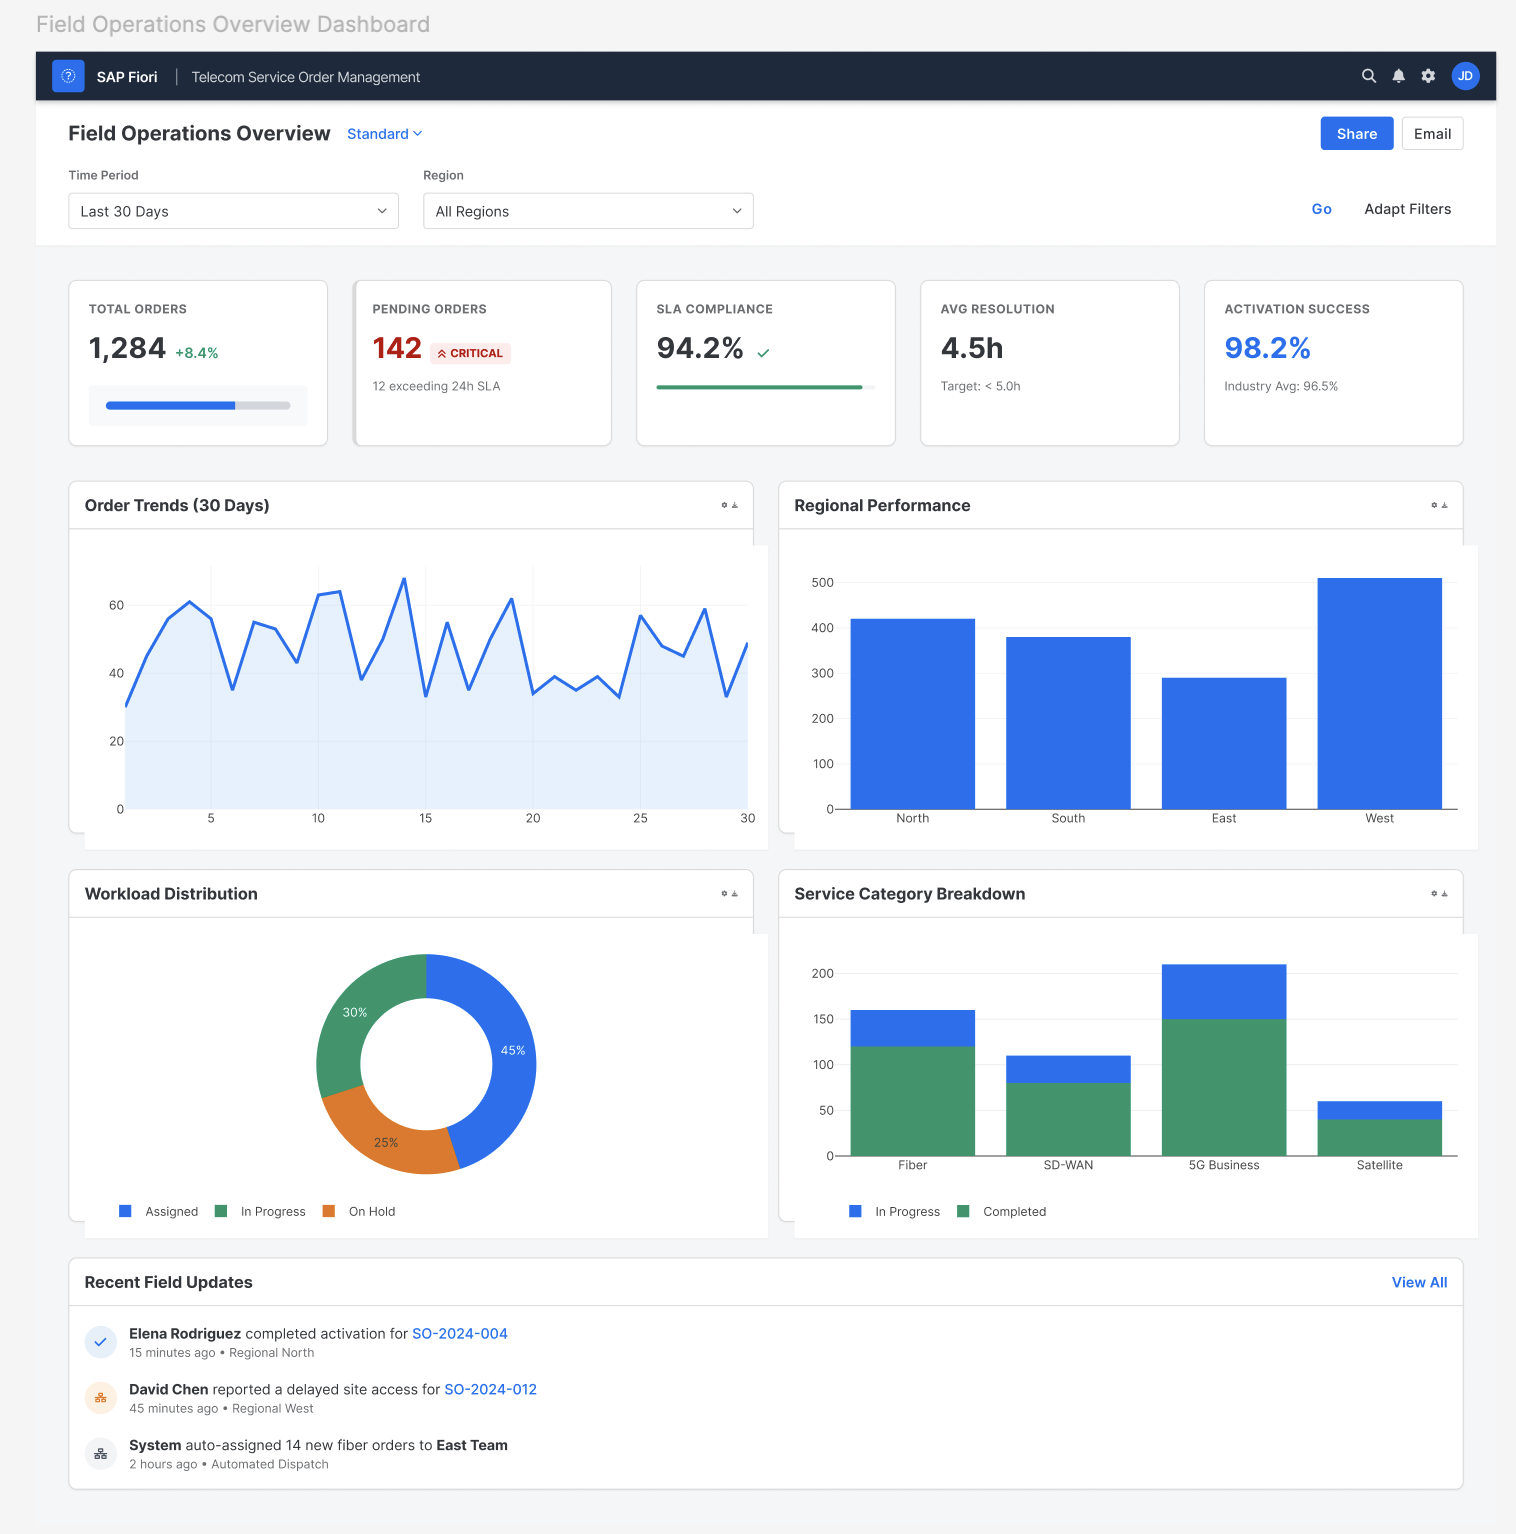
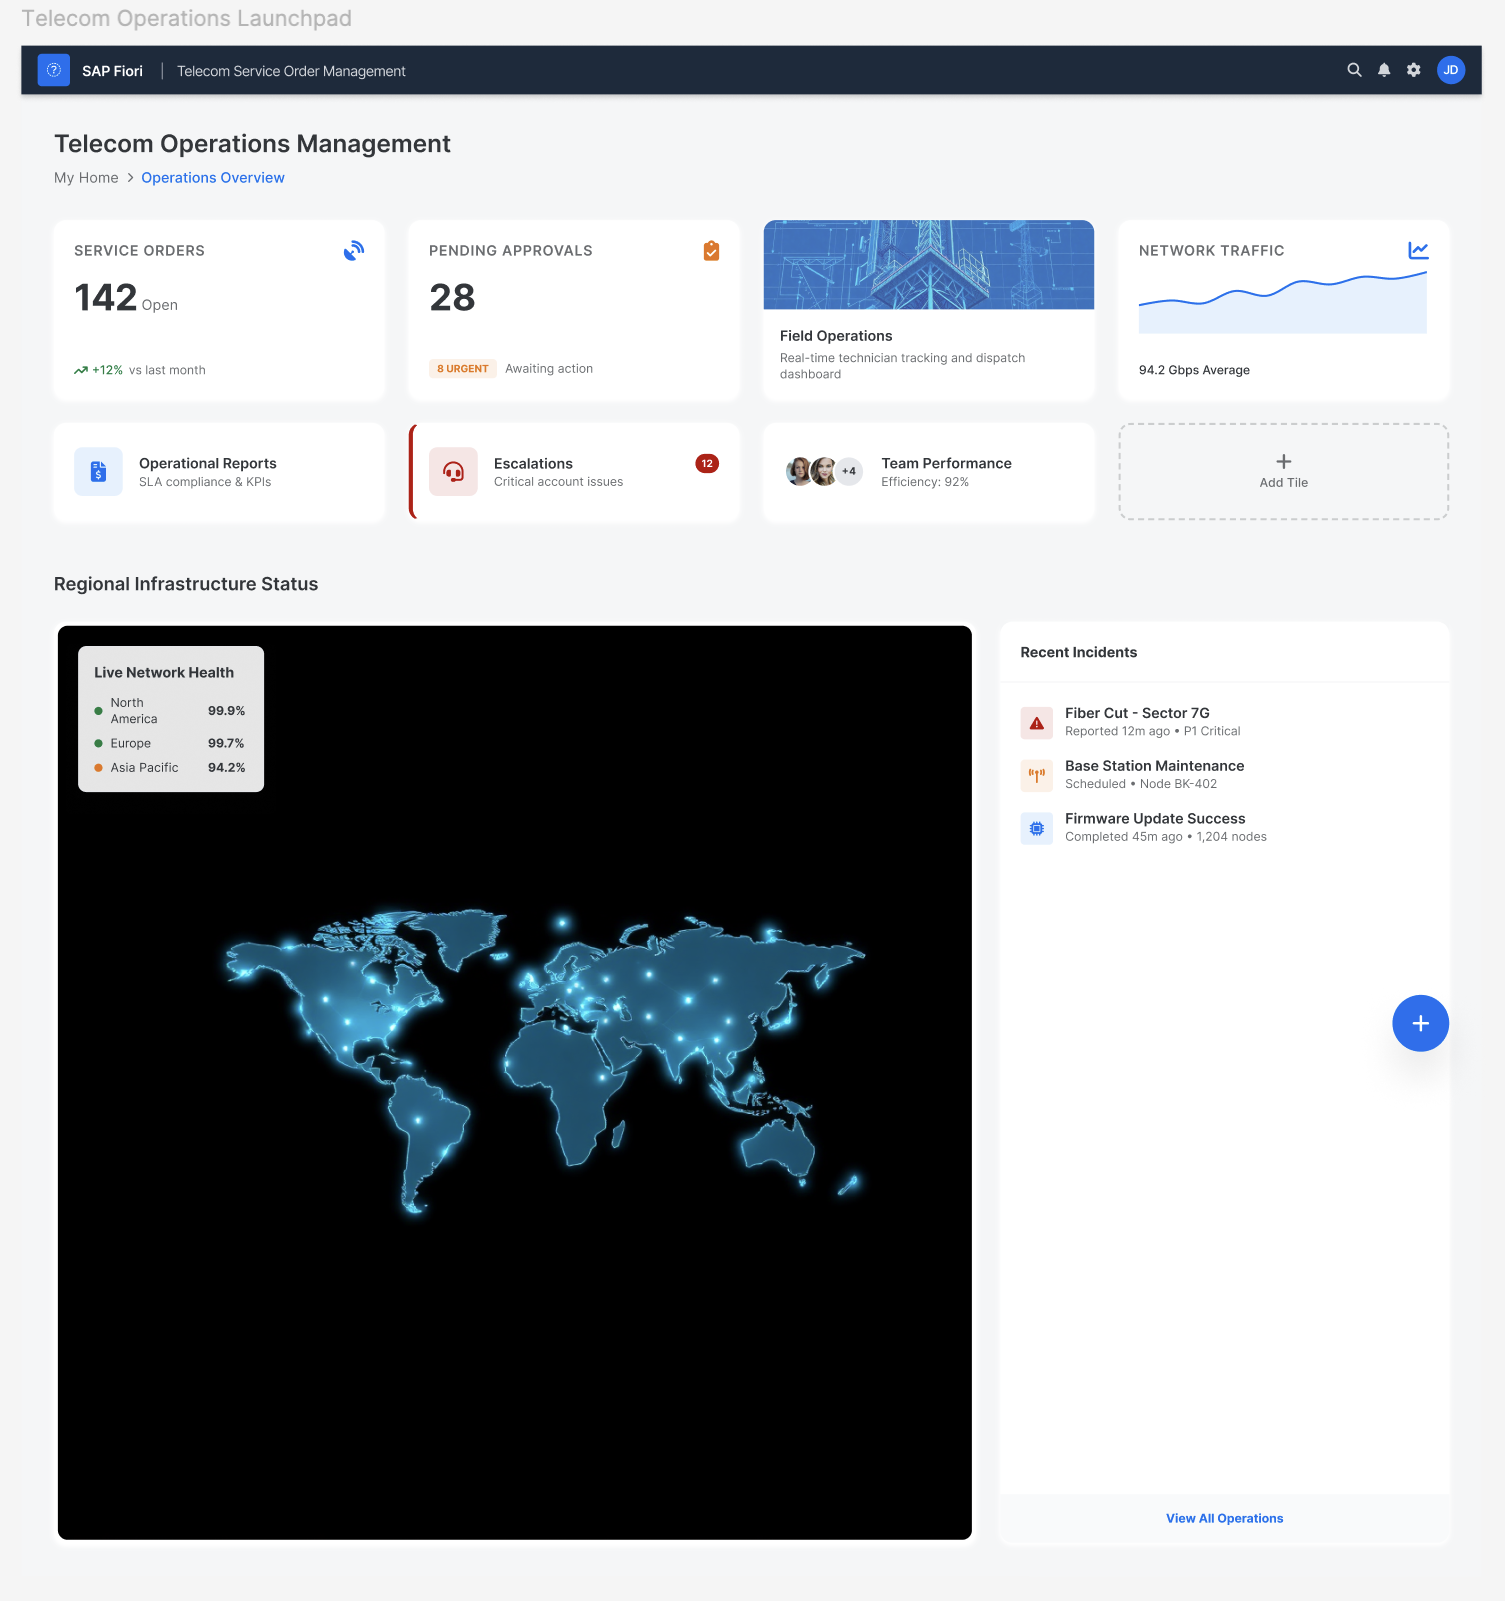
Dashboard-Driven Operations Monitoring
Challenge
Operations managers need a high-level view before investigating individual orders.
Decision
Created an Overview Dashboard showing:
- Pending Orders
- Approval Queue
- Team Performance
- Regional Infrastructure Status
- Escalations
Why
Supports strategic monitoring while allowing drill-down into details.
Impact
Improves operational awareness.
Consistent Design System
Challenge
Enterprise applications often become inconsistent over time.
Decision
Built reusable components for:
- Buttons
- Tables
- Forms
- Status Tags
- KPI Cards
- Notifications
Why
Ensures consistency across modules and accelerates future development.
Impact
Improves usability and scalability.
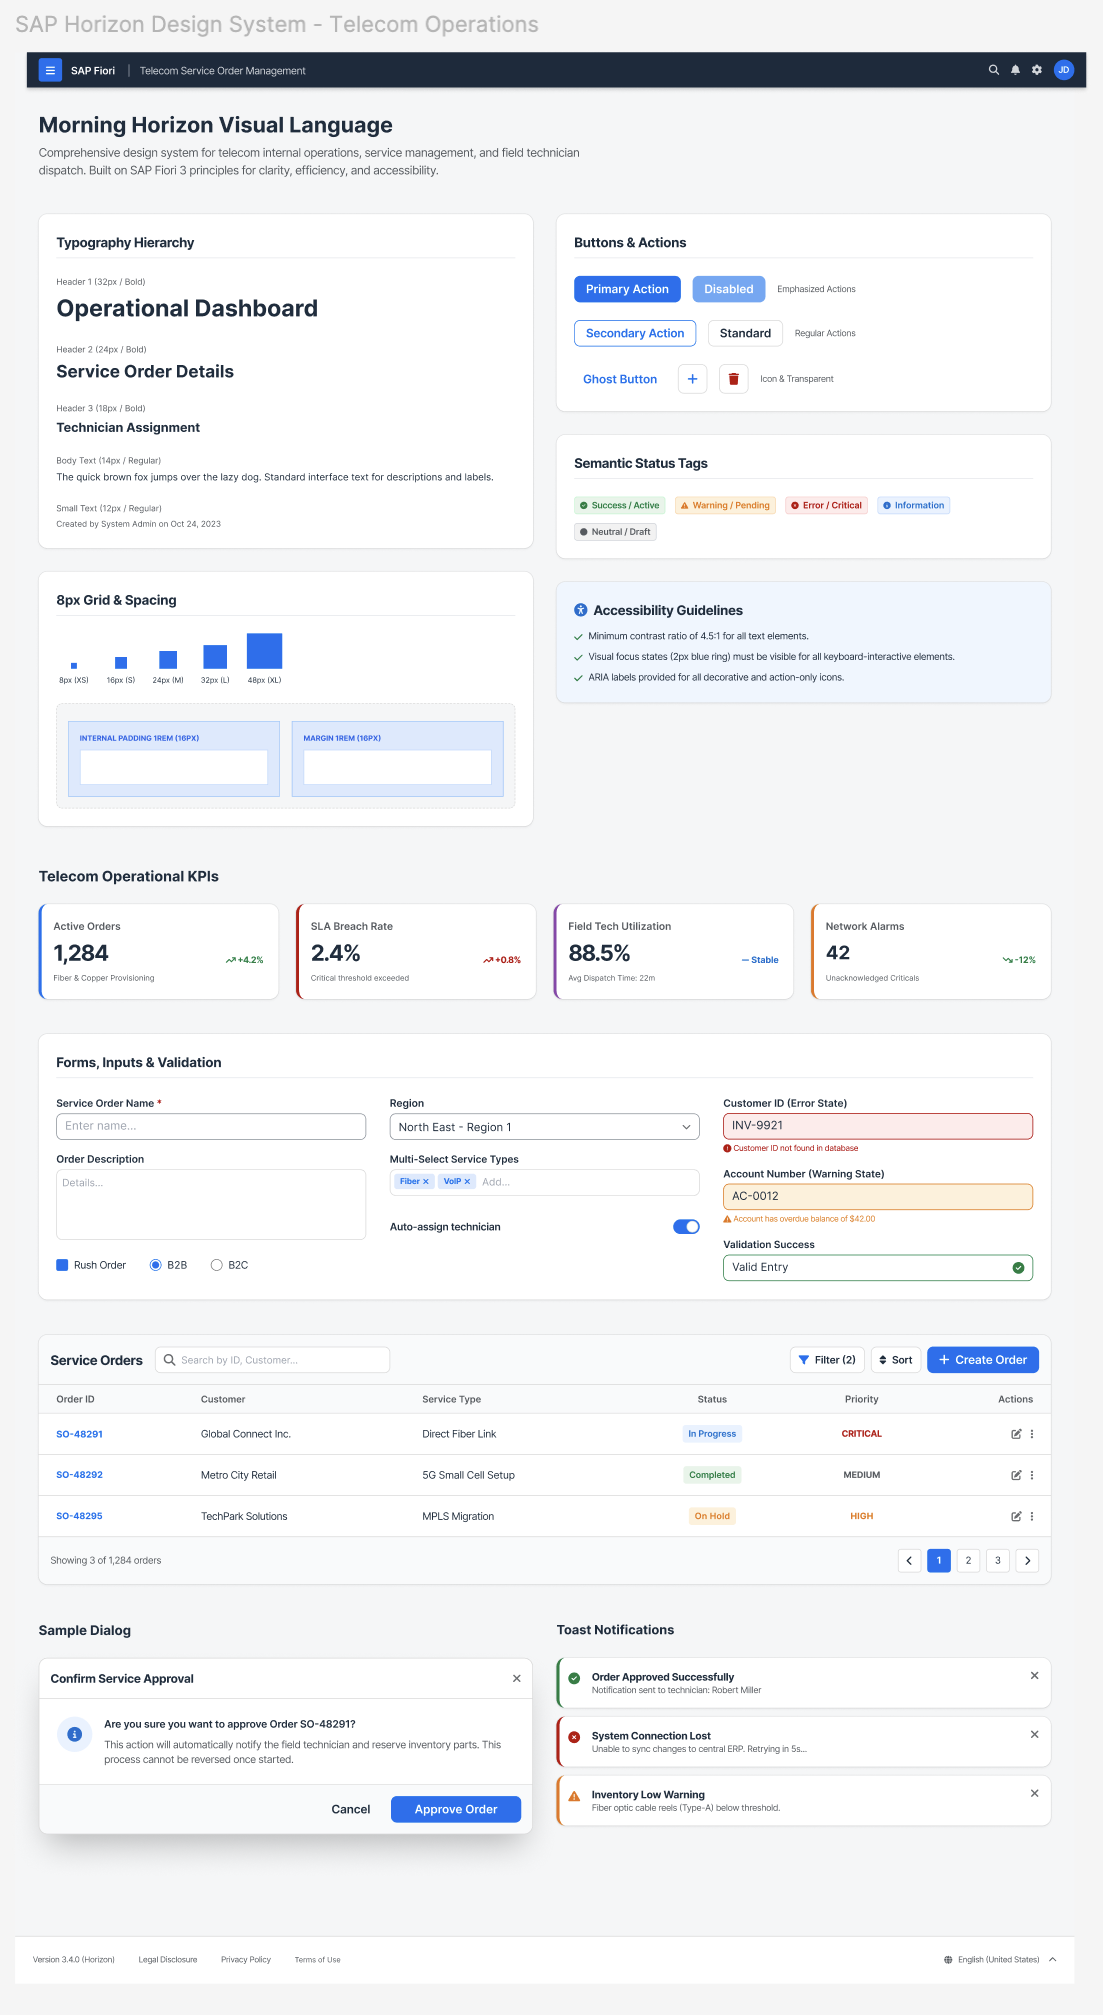
Design Systems
A reusable design system was created to ensure consistency across screens.
Components included:
- Buttons
- Forms
- Tables
- Status tags
- KPI cards
- Dialogs
- Notifications
This improved scalability and reduced design inconsistencies.
Outcome
- Designed 20+ wireframes and interactive prototypes in Figma, reducing design-to-development turnaround by 30% and accelerating feature delivery across the enterprise telecom platform.
- Simplified complex field technician workflows using user-centered design methodologies, improving task completion rates by 20% and reducing friction across critical workflows.
- Built 30+ reusable Figma components and scalable UI patterns for the enterprise design system, reducing duplicate design effort by 30% across multiple products.
- Designed data-rich dashboards and analytics interfaces that improved operational decision-making efficiency by 25%, enabling users to interpret complex operational data at a glance.
- Conducted Google Lighthouse audits in partnership with frontend developers to resolve performance bottlenecks, improving page performance, accessibility scores, and SEO readiness.
- Automated enterprise image editing — resizing, cropping, spec formatting, and background removal — using AI/ML tools, reducing processing time per batch from 2–3 hours to a few minutes, a ~97% reduction.
Built with: React · Angular · SCSS · Figma · Storybook · Google Lighthouse · WCAG 2.0
Reflection
Working within the constraints of an enterprise context pushed me to think differently than consumer UX. Every decision had to serve two audiences simultaneously — operations managers who need high-level visibility, and field reps who need to act fast on individual orders. Designing the KPI cards and color-coded SLA system taught me how much weight a single, well-placed piece of information can carry in a high-stakes workflow. If I were to extend this project, I'd validate the approval queue with real telecom ops managers to see whether priority ordering or SLA status is the more critical sorting signal. The project strengthened my ability to design end-to-end product experiences, balance business goals with user needs, and create solutions that scale across multiple devices and user journeys.
UX Principles Applied
- Information Architecture
- Visual Hierarchy
- Progressive Disclosure
- Cognitive Load Reduction
- Responsive Design
- Accessibility
- Gestalt Principles
- Recognition Over Recall
- Conversion-Centered Design
- Component-Based Design Systems